
Inflation: Starting With a ‘3’ Again…
Source: ONS
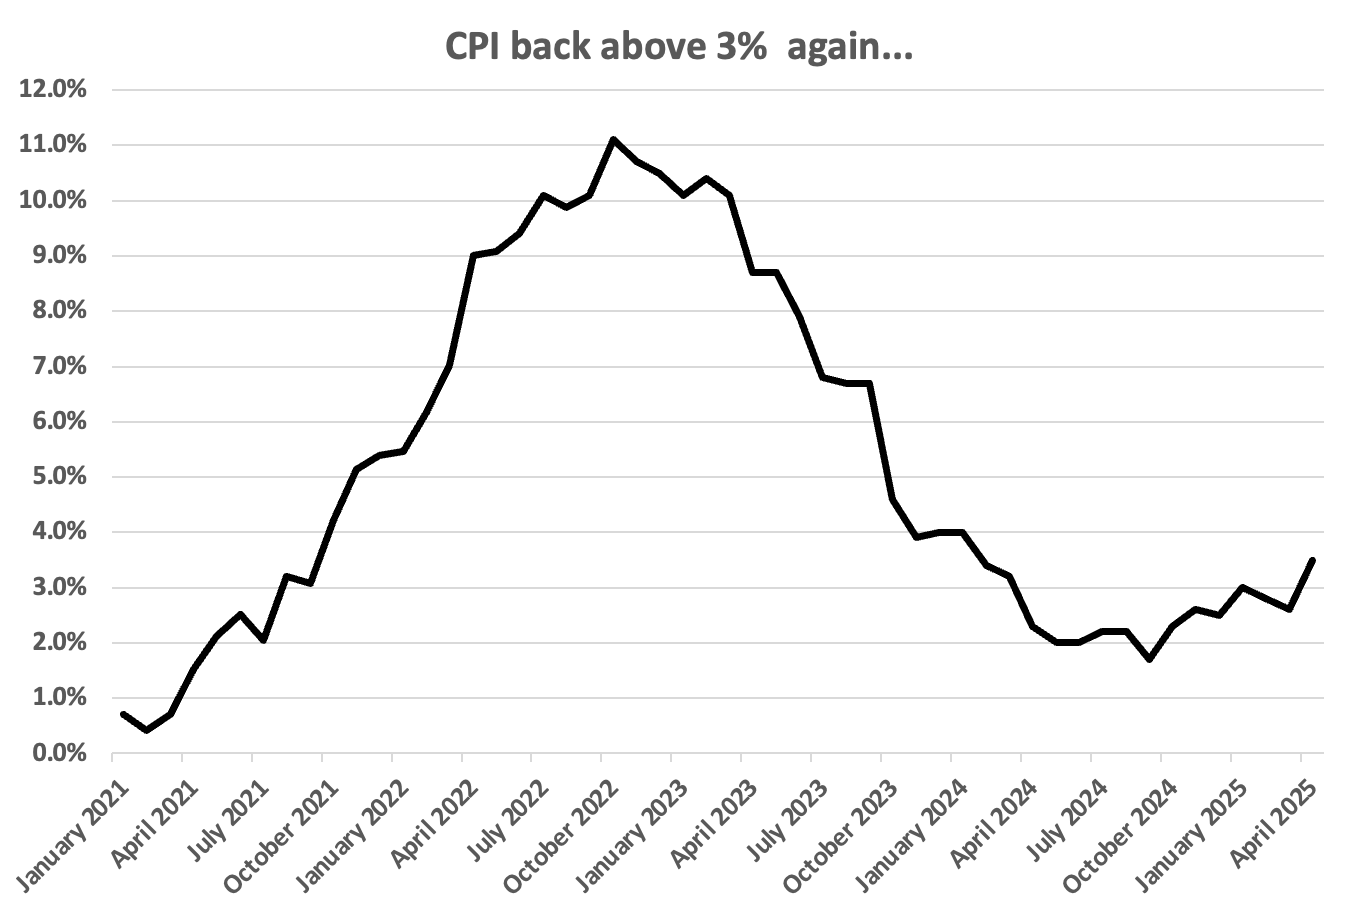
As the graph shows, inflation has been on a rollercoaster ride since the start of the decade. In August 2020, annual inflation as measured by the Consumer Prices Index was just 0.2%. A little over two years later, it was 11.1%.
That sharp upward spike surprised many economists, including those at the Bank of England. Throughout much of 2021 their assumption had been that price rises were, to use a now discredited term, “transitory”. It was not until December 2021 that the Bank increased its interest rate – from 0.1% to 0.25%. The rise marked the start of a series of interest rate increases which eventually ended In August 2023 with the Bank (Base) Rate peaking at 5.25%, where it remained for a year. By spring 2025 inflation had fallen back within the Bank’s target range (2%±1%), thanks to a mix of the high interest rate medicine and the unwinding of the COVID supply chain issues and Ukraine energy price distortions.
And then along came April…
April’s annual CPI inflation reading was 3.5%, an increase of 0.9% on March’s figure and the highest since January 2024. The Governor of the Bank of England, Andrew Bailey, had to write a mandatory letter to the Chancellor, explaining why the 1%-3% target inflation range had been missed and what the Bank was going to do to bring the rate back down.
The jump in April’s inflation figure was no surprise to practitioners of the dismal science (economics). April is a month when many price rises occur, such as the gas and electricity OFGEM cap, council tax, water rates and, increasingly, mobile and broadband charges. In 2025 there were additional inflationary pressures from the start of the higher employer National Insurance costs and the 6.7% increase in the NLW. The timing of Easter also played a part, pushing up air fares.
The utility bill rises were particularly problematic. In April 2024, the quarterly Ofgem cap fell by 12% to £1,690 a year, whereas this April it rose by 6.4% to £1,849 a year, making a year-on-year increase of 9.4%. Worse still were Ofwat’s water rate increases (which apply only to England and Wales). These marked the start of a new five-year cycle, but instead of spreading price rises over the half decade, the increase was heavily loaded to year one. Ofwat says the average water and sewerage bill has gone up by 26%, although there are significant regional variances.
Where next for inflation?
As the explanation above makes clear, April was an unusual month. However, those increases will stay in the annual inflation data until April next year, so there is not going to be a sudden summer reversal. The Bank of England is currently forecasting that inflation will peak in September 2025 at around 3.7% before gradually coming down to 2% by the first quarter of 2027. Other independent forecasters take a similar view – dare one say that the consensus is that the April 2025 inflationary jump will prove transitory?
A constant uncertainty
April’s 3.5% annual inflation is a reminder that the inflation dragon is never completely slain, despite the best efforts of the Bank of England and the many recent Chancellors. The dragon can lay dormant for long periods and then, as in 2021/22, suddenly – and ferociously – reignite. Even at lowly levels, inflation does damage – 2% inflation for ten years adds 21.9% to prices.
The corollary is that any medium or long financial planning, be it personal or business, needs to allow for inflation.